mainwindow.cpp
#include "mainwindow.h"
#include "ui_mainwindow.h"
#include < QMessageBox >
#include < QDebug >
#include < QtMath >
#include < QSharedPointer >
#include < QDialog >
#include "sdof_analytic.h"
#include "IOSignal.h"
#include "filter.h"
#include "dialog.h"
#include "filterdialog.h"
MainWindow::MainWindow(QWidget *parent)
: QMainWindow(parent)
, ui(new Ui::MainWindow)
{
ui->setupUi(this);
// TAB::: SDOF
//
//
//*********************************************************************|
// x and y axis scalers
ui->dialYaxis->setMaximum(100);
ui->dialYaxis->setMinimum(0);
ui->dialXaxis->setMaximum(10);
ui->dialXaxis->setMinimum(0);
// y radio buttons:: not exclusive
ui->radioLogX->setAutoExclusive(false);
ui->radioLogY->setAutoExclusive(false);
ui->radYlogS->setAutoExclusive(false);
ui->radXlogS->setAutoExclusive(false);
// connect the radiobuttons
connect(ui->cmdSys, SIGNAL(clicked()), SLOT(cmdSysClicked()));
connect(ui->cmdClear, SIGNAL(clicked()), SLOT(cmdClearClicked()));
connect(ui->cmdCLRA, SIGNAL(clicked()),SLOT(cmdCLRAClicked()));
// connect the scaling
connect(ui->dialYaxis ,SIGNAL(valueChanged(int)),SLOT(yAxisScaler()));
connect(ui->dialXaxis ,SIGNAL(valueChanged(int)),SLOT(xAxisScaler()));
// connect radio buttons::: both call the same function logAxis
connect(ui->radioLogX,SIGNAL(clicked()), SLOT(logAxis()));
connect(ui->radioLogY,SIGNAL(clicked()), SLOT(logAxis()));
// TAB::: PSD Analysis
//
//
//*********************************************************************|
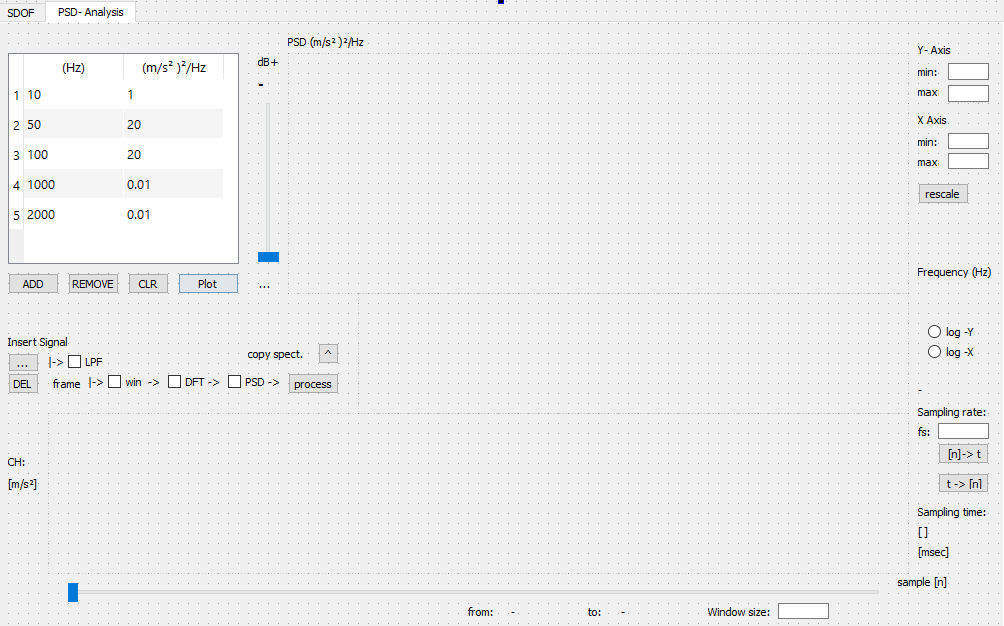
ui->slddB->setMaximum(0);
ui->slddB->setMaximum(10);
connect(ui->slddB,SIGNAL(valueChanged(int)),SLOT(on_slddB_valueChanged()));
connect(ui->edtmaxY, SIGNAL(editingFinished()),SLOT(on_editAxis()));
connect(ui->cmdYRescale, SIGNAL(clicked()),SLOT(on_editAxis()));
connect(ui->cmdCLR, SIGNAL(clicked()),SLOT(on_clr_table()));
connect(ui->cmdREM, SIGNAL(clicked()),SLOT(on_removeTableRow()));
connect(ui->cmdADD, SIGNAL(clicked()),SLOT(on_addTableRow()));
connect(ui->toolIOSignal, SIGNAL(clicked()),SLOT(on_insertSignal()));
// edit sampling time
connect(ui->cmdScaleFs,SIGNAL(clicked()), SLOT(on_cmdScaleFs()));
connect(ui->sldTimeLine,SIGNAL(valueChanged(int)),SLOT(on_WidowMovement()));
connect(ui->cmdScaleN, SIGNAL(clicked()), SLOT(on_cmdScaleN()));
connect(ui->cmdProcess,SIGNAL(clicked()), SLOT(DSP_process()));
connect(ui->cmdDel, SIGNAL(clicked()), SLOT(clearSignal()));
//| connect radio buttons for scalng Signal/DFT window)
connect( ui->radYlogS, SIGNAL(clicked()), SLOT(logSignalAxis()));
connect( ui->radXlogS, SIGNAL(clicked()), SLOT(logSignalAxis()));
//| connect spec. plotter to the main plot ...spectral plot
connect(ui->cmdCSpect, SIGNAL(clicked()),SLOT(on_cmdCSpect()));
}
MainWindow::~MainWindow()
{
delete ui;
}
//| ------------------------------------------------------ TAB 1
//|
//|
// clear the plot
void MainWindow::cmdClearClicked()
{
ui->Plot1->graph(0)->clearData();
QVector x,y;
ui->Plot1->graph(0)->setData(x,y);
ui->Plot1->update();
ui->Plot1->rescaleAxes();
ui->Plot1->replot();
ui->Plot2->graph(0)->setData(x,y);
ui->Plot2->update();
ui->Plot2->rescaleAxes();
ui->Plot2->replot();
}
// clear table CLR
void MainWindow::cmdCLRAClicked()
{
ui->lstAnalysis->clear();
}
// manipulating yAxisScaler
void MainWindow::yAxisScaler()
{
double yScale = ui ->dialYaxis->value();
double Qfact = ui->edtQ->text().toDouble();
double yrange = (1+0.01*yScale)*Qfact;
ui -> lblSlider2 -> setText(QString("%1").arg(yrange));
ui->Plot1->yAxis->setRange(0, yrange);
ui->Plot1-> replot();
}
// manipulationg xAxisSclaer
void MainWindow::xAxisScaler()
{
double i = ui->dialXaxis->value();
double f = ui->edtR->text().toDouble();
double xrange = f*((10-i)/10);
ui -> lblSlider -> setText(QString("%1").arg(i));
ui->Plot1->xAxis->setRange(f-xrange, f+xrange);
ui->Plot1-> replot();
}
// manipulate radio buttons for setting up the log. axis
void MainWindow::logAxis()
{
// Chece when button clicked
if( ui->radioLogY->isChecked()){
ui->Plot1->yAxis->setScaleType(QCPAxis::stLogarithmic);
ui->Plot1->update();
ui->Plot1->rescaleAxes();
ui->Plot1->replot();
}
else if(ui->radioLogY->isChecked()==false)
{
ui->Plot1->yAxis->setScaleType(QCPAxis::stLinear);
ui->Plot1->update();
ui->Plot1->rescaleAxes();
ui->Plot1->replot();
}
if(ui->radioLogX->isChecked()==true)
{
ui->Plot1->xAxis->setScaleType(QCPAxis::stLogarithmic);
ui->Plot1->update();
ui->Plot1->rescaleAxes();
ui->Plot1->replot();
}
else if(ui->radioLogX->isChecked()==false)
{
ui->Plot1->xAxis->setScaleType(QCPAxis::stLinear);
ui->Plot1->update();
ui->Plot1->rescaleAxes();
ui->Plot1->replot();
}
}
void MainWindow::cmdSysClicked()
{
// take the UI inputs
double fstart= ui->edtStart->text().toDouble();
double fend = ui->edtEnd->text().toDouble();
double fr = ui->edtR->text().toDouble();
double q = ui->edtQ->text().toDouble();
double N = ui->edtN->text().toDouble();
// create an SDOF - object ...
Sdof_analytic sys(fstart, fend, fr, q, N);
sys.FRF_THIS();
vector frf = sys.getFRFVector();
QVector y = QVector(frf.begin(), frf.end());
QVector x,xd;
double df = (fend-fstart)/N;
double f=0;
double disp;
for(int j = 0; j < y.size(); j++)
{
x.push_back(f);
f +=df;
disp = y[j]/pow((2*M_PI*f),2);
xd.push_back(disp);
}
// Add Graphs
ui->Plot1->addGraph();
ui->Plot1->graph(0)->setPen(QPen(Qt::black, 1));
ui->Plot1->graph(0)->setData(x,y);
ui->Plot1->update();
ui->Plot1->rescaleAxes();
ui->Plot1->replot();
ui->Plot1->setInteractions(QCP::iRangeDrag | QCP::iRangeZoom);
ui->Plot2->addGraph();
ui->Plot2->graph(0)->setPen(QPen(Qt::red, 1.5));
ui->Plot2->xAxis->setScaleType(QCPAxis::stLogarithmic);
ui->Plot2->yAxis->setScaleType(QCPAxis::stLogarithmic);
ui->Plot2->graph(0)->setData(x,xd);
ui->Plot2->update();
ui->Plot2->rescaleAxes();
ui->Plot2->replot();
ui->Plot2->setInteractions(QCP::iRangeDrag | QCP::iRangeZoom);
// ADAPTER:: reuse cout << str()/ofstream and plug it in Q String;
string s = sys.sdof_info();
QString qstr = QString::fromStdString(s);
ui->lstAnalysis->addItem(qstr);
}
//edit axis.. on the right side
void MainWindow::on_editAxis()
{
double min_y, max_y, min_x, max_x;
min_y = ui->edtminY->text().toDouble();
max_y = ui->edtmaxY->text().toDouble();
min_x = ui->edtminX->text().toDouble();
max_x = ui->edtmaxX->text().toDouble();
ui->Plot3->xAxis->setRange(0.85*min_x,max_x*1.15);
ui->Plot3->update();
ui->Plot3->replot();
ui->Plot3->yAxis->setRange(min_y,max_y);
ui->Plot3->update();
ui->Plot3->replot();
}
//| ------------------------------------------------------ TAB 2
//|
//|
void MainWindow::on_cmdCSpect()
{
//|||||||||||||||||||||||||||| conditions to activate the process is ...same as DFT/PSD
// if psd is checked
// if i have the window size
// and sampling frequency
if( ui->chkPSD->isChecked() && !ui->edtWinSize->text().isEmpty() && !ui->edtFs->text().isEmpty() )
{
ui->chkDFT->setChecked(true); //| IF PSD chekbox is on
//| turn the DFT chekbox also on ..
// check whether signal is in frequency domain, samples not accepted
if( ui->lblXSignal->text() =="t[sec]")
{
double N = ui->edtWinSize->text().toDouble();
double x1 = ui->sldTimeLine->value();
double Fs = ui->edtFs->text().toDouble();
vector win;
for(int i = 0; i to |-> QVector
vector XDFT = SOUT4Q(channel01); // signal out for Q
QVector x_dft = QVector(XDFT.begin(), XDFT.end());
//| Make the frequency axis
QVector f_vec;
double fi=0;
double df = channel01.fs/N;
for(int i =0; i< x_dft.size(); i++) //| x_dft.size == N/2 !
{
fi += df;
f_vec.push_back(fi);
}
QVector x_psd;
double psd_i;
// dft to psd ...
for(int i=0; i < x_dft.size() ; i++)
{
// ( m/s² )² / Hz
psd_i = pow(x_dft[i], 2)/df;
x_psd.push_back(psd_i);
}
/*
dakle ako se profil ucita
*/
if(ui->lblSalic->text()=="" )
{
//if time signal is here and no profile has beeen created
// plot the spectrum as it is ..
ui->Plot3->addGraph();
ui->Plot3->graph(3)->setPen(QPen(Qt::darkGray, 1));
ui->Plot3->graph(3)->setData(f_vec,x_psd);
ui->Plot3->update();
ui->Plot3->replot();
}
else if( ui->lblSalic->text()=="...") // no profile inside the screen plot3 is empty
{
ui->Plot3->addGraph();
ui->Plot3->graph(0)->setPen(QPen(Qt::red, 2));
ui->Plot3->graph(0)->setData(f_vec,x_psd);
ui->Plot3->rescaleAxes();
ui->Plot3->update();
ui->Plot3->replot();
qInfo() << "text()==...";
qInfo() << f_vec[100] <<", " << x_psd[100];
}
else if(ui->lblSalic->text()=="" && ui->slddB->value()!=0) // ocito startni slddB nije 0
{
ui->Plot3->addGraph();
ui->Plot3->graph(3)->setPen(QPen(Qt::darkGray, 1));
ui->Plot3->graph(3)->setData(f_vec,x_psd);
ui->Plot3->update();
ui->Plot3->replot();
}
}
}
// qInfo()<<"||||||||||||||||||||||||||| end of function ... ";
}// end of function
void MainWindow::logSignalAxis()
{
if( ui->radXlogS->isChecked())
{
ui->Plot5->xAxis->setScaleType(QCPAxis::stLogarithmic);
ui->Plot5->update();
ui->Plot5->rescaleAxes();
ui->Plot5->replot();
}
else if( ui->radXlogS->isChecked()==false)
{
ui->Plot5->xAxis->setScaleType(QCPAxis::stLinear);
ui->Plot5->update();
ui->Plot5->rescaleAxes();
ui->Plot5->replot();
}
if( ui->radYlogS->isChecked())
{
ui->Plot5->yAxis->setScaleType(QCPAxis::stLogarithmic);
ui->Plot5->update();
ui->Plot5->rescaleAxes();
ui->Plot5->replot();
}else if (ui->radYlogS->isChecked()==false)
{
ui->Plot5->yAxis->setScaleType(QCPAxis::stLinear);
ui->Plot5->update();
ui->Plot5->rescaleAxes();
ui->Plot5->replot();
}
}
void MainWindow::on_cmdScaleN()
{
ui->edtFs->setText("");
ui->lblXSignal->setText("sample [n]");
ui->lblSTime->setText("Samples:");
ui->lblTs->setText(QString::number(ch_1.size()));
ui->lblUnitTs->setText("");
ui->lblSecret->setText("[n]");
// return the signal to the
ti.clear();
for(int i = 0; i< ch_1.size();i ++){
ti.push_back(i);
};
double max = *std::max_element(ch_1.constBegin(),ch_1.constEnd());
ui->Plot4->graph(0)->setPen(QPen(Qt::red, 1));
ui->Plot4->graph(0)->setData(ti,ch_1);
ui->Plot4->update();
ui->Plot4->rescaleAxes();
ui->Plot4->yAxis->setRange(-max*1.2, max*1.2);
ui->Plot4->replot();
}
void MainWindow::on_WidowMovement()
{
//| if no data about sampling frequency
//| if no signal input
//| slider set to <1,1000>
//| if signal is in the program
//| slider goes up to the last sample number
//| if window size is also known
//| slider goes to range (signal size - window size)
//| on slider movement show window
// if sampling frequency is NOT known
if( ui->edtFs->text().isEmpty())
{
ui->sldTimeLine->setMinimum(1);
if(ch_1.size()==0) // and vector is empty
{
ui->sldTimeLine->setMaximum(1000); //| set maximum of slider to 1e3
}
else
{
ui->sldTimeLine->setMaximum(ch_1.size()); //| else set to sinal size
if(!ui->edtWinSize->text().isEmpty() && ui->lblXSignal->text()=="sample [n]") //| if window-size edit filed is NOT empty
{ //| AND we have samples on X axis
// Take the window size in samples and proceed with computations...
double winSize = ui->edtWinSize->text().toDouble();
ui->sldTimeLine->setMaximum(ch_1.size()-winSize);
int win_0 = ui->sldTimeLine->value();
int win_e = win_0 + winSize;
QVector BL,xl; //| aux vectors for showing the window
double max = *std::max_element(ch_1.constBegin(),ch_1.constEnd());
double cursorScale = 1.15;
BL.push_back(-max*cursorScale);
BL.push_back(max*cursorScale);
BL.push_back(max*cursorScale);
BL.push_back(-max*cursorScale);
xl.push_back(win_0);
xl.push_back(win_0);
xl.push_back(win_e);
xl.push_back(win_e);
ui->lblWinMin->setText(QString::number(win_0));
ui->lblWinMax->setText(QString::number(win_e));
ui->Plot4->addGraph();
ui->Plot4->graph(1)->setData(xl,BL);
ui->Plot4->graph(1)->setPen(QPen(Qt::black, 1));
ui->Plot4->update();
ui->Plot4->replot();
BL.clear(); xl.clear();
}// end of case::window size konwn and samples on the x axis ..
}// end vector not empty ...
}// end if sampling frequency added
// if sampling frequency IS GIVEN
if( !ui->edtFs->text().isEmpty() && !ui->edtWinSize->text().isEmpty() && ui->lblXSignal->text() =="t[sec]")
{
//| if sampling frequency is NOT empty, AND you have window size
//| and you have the "t[sec]" on X Axis
//| set labels reight to X axis
double fs = ui->edtFs->text().toDouble();
double ts = 1/fs;
//| set slider to signal size ...
ui->sldTimeLine->setMaximum(ch_1.size()); //| else set to sinal size
double winSize = ui->edtWinSize->text().toDouble(); //| window size in samples ...
double winSizeT = winSize*ts; //| window size in seconds ...
ui->sldTimeLine->setMaximum(ch_1.size()-winSize); //| slider takes the same windowsize ..in samples
double win_0T = ui->sldTimeLine->value()*ts; //| window starting time in sec
double win_eT = win_0T + winSizeT; //| window end time in sec
QVector BT,xt;
double max = *std::max_element(ch_1.constBegin(),ch_1.constEnd()); //| take maximum in signal scale it up 15% +
double cursorScale = 1.15;
BT.push_back(-max*cursorScale);
BT.push_back(max*cursorScale);
BT.push_back(max*cursorScale);
BT.push_back(-max*cursorScale);
xt.push_back(win_0T);
xt.push_back(win_0T);
xt.push_back(win_eT);
xt.push_back(win_eT);
double TO_MSEC =1000; // sale values by factor to get secons/mseconds
ui->lblWinMin->setText(QString::number(win_0T*TO_MSEC));
ui->lblWinMax->setText(QString::number(win_eT*TO_MSEC));
ui->lblSecret->setText(" =" + QString::number(winSizeT*TO_MSEC) + " [msec]");
ui->Plot4->addGraph();
ui->Plot4->graph(1)->setData(xt,BT);
ui->Plot4->graph(1)->setPen(QPen(Qt::darkGreen, 1));
ui->Plot4->update();
ui->Plot4->replot();
BT.clear();
xt.clear();
}
else if(!ui->edtFs->text().isEmpty() && ui->edtWinSize->text().isEmpty() && ui->lblXSignal->text() =="t[sec]")
{
//| if sampling frequency is NOT empty, AND DON'T have window size
//| and you have the "t[sec]" on X Axis
//| Enter number of samples to get the time window
try {
QMessageBox popup;
popup.setText("Enter 'Window Size' to slide the window through signal.. ");
popup.exec();
}catch (exception &e) {
}
}
//| if window ChkBox is on:: zoom what is in the windwo ...in time or samples
if( ui->chkWin->isChecked() && !ch_1.isEmpty())
{
//if window size is given
if(!ui->edtWinSize->text().isEmpty())
{
double winSize = ui->edtWinSize->text().toDouble();
double win0 = ui->sldTimeLine->value();
double wine = winSize + win0;
QVector x_temp;
QVector y_temp;
ui->Plot5->addGraph();
ui->Plot5->graph(0)->clearData();
//|||| Time Series:: from Window & but no sampling frequency
if(ui->edtFs->text().isEmpty())
{
//| sampling frequency field is empty => use samples
for(int i = win0; iedtFs->text().isEmpty()) //| sampling frequency file is not empty .. use time vector
{
// scale the x axis ..
double fs = ui->edtFs->text().toDouble();
for(int i = win0; iPlot5->graph(0)->setData(x_temp,y_temp);
ui->Plot5->update();
ui->Plot5->rescaleAxes();
ui->Plot5->yAxis->setRange(-maxy*1.5, maxy*1.5);
ui->Plot5->replot();
// clear vectors
x_temp.clear();
y_temp.clear();
}
}
// if you want to process frame on slider movements uncomment this conditions
if( !ui->edtFs->text().isEmpty() && !ch_1.empty() && !ui->edtWinSize->text().isEmpty() && ui->chkWin->isChecked() )
{
//....| if there is a sampling frequency
//......| and if channel values are within the
//..........| and if edtWinSize
if( ui->chkDFT->isChecked() || ui->chkPSD->isChecked())
{
//.....| if any of the chkBoxes is on .. activate DSP_process() function ...
//.....
//DSP_process();
}
}
if(!ui->chkDFT->isChecked())
{
ui->lblWinX2->setText("{-}");
}
}// end of whole function on_WindowMovement();
// IF cmdProcess clicked this is called as -> DSP_process(0/1)
void MainWindow::DSP_process()
{
if( ui->chkPSD->isChecked())
{
ui->chkDFT->setChecked(true); //| IF PSD chekbox is on
} //| turn the DFT chekbox also on ..
// INPUT :: take the window from signal, take the inputs from the ui
double N = ui->edtWinSize->text().toDouble();
double x1 = ui->sldTimeLine->value();
double Fs = ui->edtFs->text().toDouble();
vector win;
for(int i = 0; ichkDFT->isChecked() && ui->chkWin->isChecked() && !ui->edtFs->text().isEmpty())
{
// make the dsp channel
IOSignal channel00;
channel00.fs = Fs;
channel00.inputRe(win);
DFT(channel00); //| see IOSignal.h for the model reference
//| std::vector to |-> QVector
vector XDFT = SOUT4Q(channel00);
QVector x_dft = QVector(XDFT.begin(), XDFT.end());
//| make the frequency axis
QVector f_vec;
double fi=0;
double df = channel00.fs/N;
for(int i =0; i< x_dft.size(); i++) //| x_dft.size == N/2 !
{
fi += df;
f_vec.push_back(fi);
}
double max = *std::max_element(x_dft.constBegin(),x_dft.constEnd());
ui->Plot5->graph(0)->setPen(QPen(Qt::darkGreen, 1));
ui->Plot5->yAxis->setRange(-max*0.2, max*1.2);
//| if is to be computd ||||||||||||||||||||||||||||||||______PSD checkbox ..|
if( ui->chkPSD->isChecked() )
{
QVector x_psd;
double psd_i;
for(int i=0; i < x_dft.size() ; i++)
{
// ( m/s² )² / Hz
psd_i = pow(x_dft[i], 2)/df;
x_psd.push_back(psd_i);
}
for(int i=0; i < x_dft.size() ; i++)
{
//| vector swap
psd_i = x_psd[i];
x_dft[i] = psd_i;
}
ui->Plot5->graph(0)->setPen(QPen(Qt::black, 1));
}
//| converter of the vector -> QVector
ui->Plot5->graph(0)->setData(f_vec,x_dft);
ui->Plot5->update();
ui->Plot5->rescaleAxes();
ui->Plot5->replot();
ui->Plot5->setInteractions(QCP::iRangeDrag | QCP::iRangeZoom);
ui->Plot5->graph(0)->setPen(QPen(Qt::darkRed, 1));
ui->lblWinX2->setText("{Hz}");
}
else if(!ui->chkDFT->isChecked())
{
ui->lblWinX2->setText("{-}");
}
/*
|||||||||||||||||||||||||||||||||||||||||||||||||||||||||||____ LPF checkbox |
*/
//|---- if Low pass filter is on and sampling frequency is given ...
if(ui->chkLPF->isChecked() && !ui->edtFs->text().isEmpty() )
{
// POP UP DIALOG********************* Filter Cutoff
//
// pop up filter dialog for setting up the filter on the channel ..
//**************************************************************************
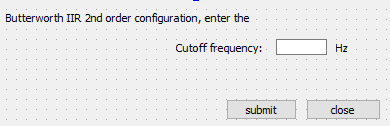
FilterDialog myFilter;
myFilter.setModal(true);
myFilter.exec();
//**************************************************************************
if(myFilter.submitPressed==true) //| if user accepts the
{
double fcut = myFilter.getCutoff(); //| Take user entered cutoff frequency
DEQ filterSystem; //| Setup teh differential equations ...
Coeff lpf = LPF_butter(fcut,Fs); //| LPF filter butterworth ...
QVector y_filt; //| filtered signal y_filt;
for(int i =0; i < ch_1.size(); i++)
{
y_filt.push_back(filterSystem.process(lpf, ch_1[i]));
}
// Plot the filtered signal upon the existing
ui->Plot4->addGraph();
ui->Plot4->graph(1)->setPen(QPen(Qt::darkGreen, 0.8));
ui->Plot4->graph(1)->setData(ti,y_filt);
ui->Plot4->update();
ui->Plot4->replot();
// POP UP DIALOG********************* Accepting the filtered signal ...
// CONFIRM FILTERING
// pop up filter dialog for setting up the filter on the channel ..
//**************************************************************************
Dialog IsThisOk;
IsThisOk.setModal(true);
IsThisOk.exec();
// if user accepts the results of LPF
if(IsThisOk.Accepted == true)
{
//| take filtered data to global vector
//| then clear the graphs
ui->Plot4->graph(0)->clearData();
ui->Plot4->graph(1)->clearData();
ui->Plot4->update();
ui->Plot4->replot();
// then set the data again ..
ui->Plot4->graph(0)->setData(ti,y_filt);
ui->Plot4->update();
ui->Plot4->replot();
double temp;
//ch_1.clear();
for(int i=0; i< ch_1.size(); i++)
{
temp = y_filt[i];
ch_1[i] = temp;
}
}
// turn the filter off
ui->chkLPF->setChecked(false);
}
}
}// end of DSP_process();
// CLEAR all vectors and graphs in signal
void MainWindow::clearSignal()
{
// if there is a signal in the program
if( !ch_1.empty())
{
// clear global vectors
ch_1.clear();
ti.clear();
// ckear plots
ui->Plot4->graph(0)->setData(ti,ch_1);
ui->Plot4->graph(1)->clearData();
ui->Plot4->graph(2)->clearData();
ui->Plot4->update();
ui->Plot4->replot();
ui->Plot5->graph(0)->clearData();
ui->Plot5->update();
ui->Plot5->replot();
}
// uncheck all buttons
ui->chkLPF->setChecked(false);
ui->chkWin->setChecked(false);
ui->chkDFT->setChecked(false);
ui->chkPSD->setChecked(false);
// clear all windows ..
ui->edtFs->setText("");
ui->edtWinSize->setText("");
//qInfo() << "clearSiagnal() finished.. ";
}
// for moving the X axis to time
void MainWindow::on_cmdScaleFs()
{
//| If there is no signal in interface
if( ch_1.isEmpty() && ti.isEmpty() )
{
QMessageBox msgBox;
msgBox.setText("Input Channel before editing time series ... ");
msgBox.exec();
}
else{
//| if slider not set to zero
double sldValue = ui->sldTimeLine->value();
ui->lblSecret->setText("");
if(sldValue > 0) //|if slider already moved, than evertything rescaled
{ //| there is an old signal window, so clear it
ui->Plot4->graph(1)->clearData();
ui->Plot4->update();
ui->Plot4->replot();
}
//| clear window size
//ui->edtWinSize->setText("");
if(!ui->edtFs->text().isEmpty()) //| if Fs field is active, sampling frequency is given .. therefore
{
double Fs = ui->edtFs->text().toDouble();
double ts = 1/Fs;
double ts_msec = ts*1e3;
ti.clear();
ui->lblSTime->setText("Sampling time:");
ui->lblTs->setText(QString::number(ts_msec));
ui->lblUnitTs->setText("[msec]");
ui->lblXSignal->setText("t[sec]");
//qInfo()<< "Fs" << Fs << "ts" << ts <<"\n";
double t = 0;
for(int i = 0; iPlot4->graph(0)->setPen(QPen(Qt::darkBlue, 1));
ui->Plot4->graph(0)->setData(ti,ch_1);
ui->Plot4->update();
ui->Plot4->rescaleAxes();
ui->Plot4->yAxis->setRange(-max*1.2, max*1.2);
ui->Plot4->replot();
}else
{
QMessageBox msgBox;
msgBox.setText("Enter the sampling frequency ... ");
msgBox.exec();
}
}
}
// tool button inserting signal into interface
void MainWindow::on_insertSignal()
{
clearSignal();
QString file_name = QFileDialog::getOpenFileName(this,"open file","C://");
// qInfo()<< file_name ;
QFile txtFile(file_name); //| create filename
// if file is not opened
if(txtFile.open(QFile::ReadOnly))
{
QTextStream in(&txtFile);
while(! in.atEnd())
{
QString line = in.readLine();
ch_1.push_back(line.toDouble());
}
txtFile.close();
}
// time vector
for(int i=0; i < ch_1.size(); i++ )
{
ti.push_back(i);
}
ui->sldTimeLine->setMaximum(ch_1.size());
double max = *std::max_element(ch_1.constBegin(),ch_1.constEnd());
// plot inported signal to plot 4
ui->Plot4->addGraph();
ui->Plot4->graph(0)->setPen(QPen(Qt::red, 1));
ui->Plot4->graph(0)->setData(ti,ch_1);
ui->Plot4->update();
ui->Plot4->rescaleAxes();
ui->Plot4->yAxis->setRange(-max*1.2, max*1.2);
ui->Plot4->replot();
ui->Plot4->setInteractions(QCP::iRangeDrag | QCP::iRangeZoom);
}
// add the row to the profile table
void MainWindow::on_addTableRow()
{
int N = ui->tableWidget->rowCount();
ui->tableWidget->insertRow(N);
}
// remove the row from the profile table
void MainWindow::on_removeTableRow()
{
int N = ui->tableWidget->rowCount(); // | vorsicht, der C++ zaehlt ab dem index 0, also der Nte in der Reihe ist der N-1te
ui->tableWidget->removeRow(N-1);
}
// clear table
void MainWindow::on_clr_table()
{
int N = ui->tableWidget->rowCount();
if(N>0){
// Reading profile data
for(int i = 0; i < N ; i++)
{
ui->tableWidget->item(i,0)->setText("");
ui->tableWidget->item(i,1)->setText("");
}
QMessageBox msgBox;
msgBox.setText("The table has been cleared.");
msgBox.exec();
}
}
// cmd read profile
void MainWindow::on_cmdRead_clicked()
{
// reset the dB borders to 0
ui->slddB->setValue(0);
int N = ui->tableWidget->rowCount();
// int M = ui->tableWidget->columnCount();
ui->lblSalic->setText("");
// Reading profile data
QVector x_fr,y_psd;
x_fr.clear();
y_psd.clear();
for(int i = 0; i < N ; i++)
{
double x = ui->tableWidget->item(i,0)->text().toDouble();
double y = ui->tableWidget->item(i,1)->text().toDouble();
//qInfo()<Plot3->addGraph();
ui->Plot3->graph(0)->setPen(QPen(Qt::black, 1));
ui->Plot3->graph(0)->setData(x_fr,y_psd);
ui->Plot3->xAxis->setScaleType(QCPAxis::stLogarithmic);
ui->Plot3->yAxis->setScaleType(QCPAxis::stLogarithmic);
//QSharedPointer logTicker(new QCPAxisTickerLog);
ui->Plot3->xAxis2->setVisible(true);
ui->Plot3->xAxis2->setTickLabels(false);
ui->Plot3->yAxis2->setVisible(true);
ui->Plot3->yAxis2->setTickLabels(false);
connect(ui->Plot3->xAxis, SIGNAL(rangeChanged(QCPRange)), ui->Plot3->xAxis2, SLOT(setRange(QCPRange)));
connect(ui->Plot3->yAxis, SIGNAL(rangeChanged(QCPRange)), ui->Plot3->yAxis2, SLOT(setRange(QCPRange)));
ui->Plot3->update();
ui->Plot3->rescaleAxes();
ui->Plot3->replot();
double max_f = *std::max_element(x_fr.constBegin(),x_fr.constEnd()); //| max number in freq
double min_f = *std::min_element(x_fr.constBegin(),x_fr.constEnd()); //| min number
double max_psd = *std::max_element(y_psd.constBegin(),y_psd.constEnd()); //| max number in y_psd
ui->Plot3->xAxis->setRange(0.85*min_f, 1.25*max_f);
ui->Plot3->yAxis->setRange(0,4*max_psd);
ui->Plot3->replot();
ui->Plot3->setInteractions(QCP::iRangeDrag | QCP::iRangeZoom);
}
// slider dB mover
void MainWindow::on_slddB_valueChanged()
{
// read the user input
double w = ui->slddB->value();
ui->lbldB->setText(QString("%1").arg(w));
if(ui->lblSalic->text()=="...")
{
// do nothing ..
}
else
{
// go throught the table and pick up the profile
// Reading profile data and fill up the vector xdB, ydB
double x,y;
QVector xdB,ydB_HIGH,ydB_LOW;
int N = ui->tableWidget->rowCount();
for(int i = 0; i < N ; i++)
{
x = ui->tableWidget->item(i,0)->text().toDouble();
y = ui->tableWidget->item(i,1)->text().toDouble();
ydB_HIGH.push_back( y* pow(10, w/10)); // ydB = y x 10^(dB/10)
ydB_LOW.push_back( y/ pow(10, w/10)); // ydB = y x 10^(dB/10)
xdB.push_back(x);
}
// print vectors to the console
//for(int i = 0; i < N ; i++) {qInfo()<< xdB[i] << " " << ydB_LOW[i] << "\n"; }
ui->Plot3->addGraph();
ui->Plot3->graph(1)->setPen(QPen(Qt::green, 1));
ui->Plot3->graph(1)->setData(xdB,ydB_HIGH);
//ui->Plot3->replot();
ui->Plot3->addGraph();
ui->Plot3->graph(2)->setPen(QPen(Qt::blue, 0.5));
ui->Plot3->graph(2)->setData(xdB,ydB_LOW);
ui->Plot3->replot();
}
}